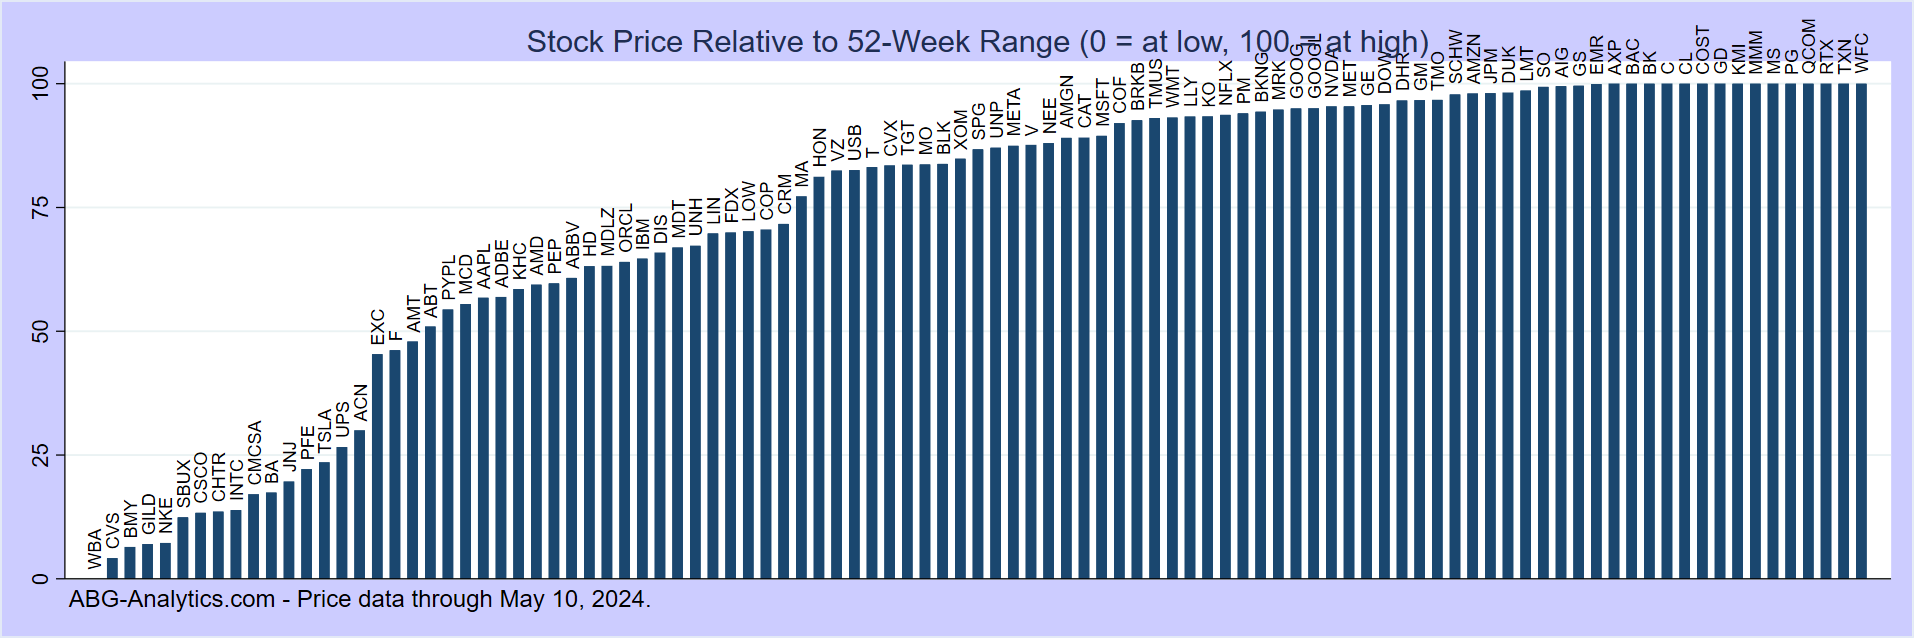
Stocks Trading Near 52-Week Highs and Lows
| Ticker - Company | Closing Price | 52-Week Low | 52-Week High | Price Relative to 52 Week Range (0 to 100%) |
|---|---|---|---|---|
| Apple Inc (NASDAQ:AAPL) | $315.32 | $202.38 | $316.22 | 99% |
| Bank Of America Corp (NYSE:BAC) | $59.67 | $44.92 | $59.90 | 99% |
| Bank of New York Mellon Corporation (NYSE:BNY) | $151.92 | $93.72 | $152.91 | 99% |
| CVS Health Corporation (NYSE:CVS) | $104.15 | $58.75 | $104.81 | 99% |
| General Dynamics Corp (NYSE:GD) | $375.06 | $297.05 | $376.88 | 98% |
| JPMorgan Chase and Co (NYSE:JPM) | $336.47 | $282.84 | $339.22 | 96% |
| Coca-Cola Co (NYSE:KO) | $83.49 | $65.67 | $84.14 | 97% |
| Metlife Inc (NYSE:MET) | $91.65 | $67.70 | $91.67 | 100% |
| Morgan Stanley (NYSE:MS) | $222.28 | $139.09 | $227.09 | 96% |
| Starbucks Corporation (NASDAQ:SBUX) | $106.01 | $78.46 | $106.82 | 98% |
| Turn rapeutics Inc (NASDAQ:TTRX) | $ 9.44 | $ 2.71 | $ 9.71 | 98% |
| UnitedHealth Group Inc (NYSE:UNH) | $424.62 | $237.77 | $431.68 | 97% |
| Union Pacific Corp (NYSE:UNP) | $286.96 | $214.91 | $286.96 | 100% |
| US Bancorp (NYSE:USB) | $62.41 | $43.94 | $62.89 | 98% |
| Ticker - Company | Closing Price | 52-Week Low | 52-Week High | Price Relative to 52 Week Range (0 to 100%) |
|---|---|---|---|---|
| Lowes Companies Inc (NYSE:LOW) | $211.63 | $206.64 | $287.39 | 7% |
| Pepsico Inc (NASDAQ:PEP) | $137.38 | $133.81 | $170.49 | 11% |
Methods
- Stocks are deemed to be near their 52-week high (low) if they are within 3 percent of the high (low) or they achieved a new high (low) within the 5 most recent market days.
- Price relative to 52-week range is calculated as [log(price)-log(low price)]/[log(high price)-log(low price)]*100%. Thus a stock with a current price of $4 with a 52-week high of $8 and a 52-week low of $2 will have price relative to range of 50%.