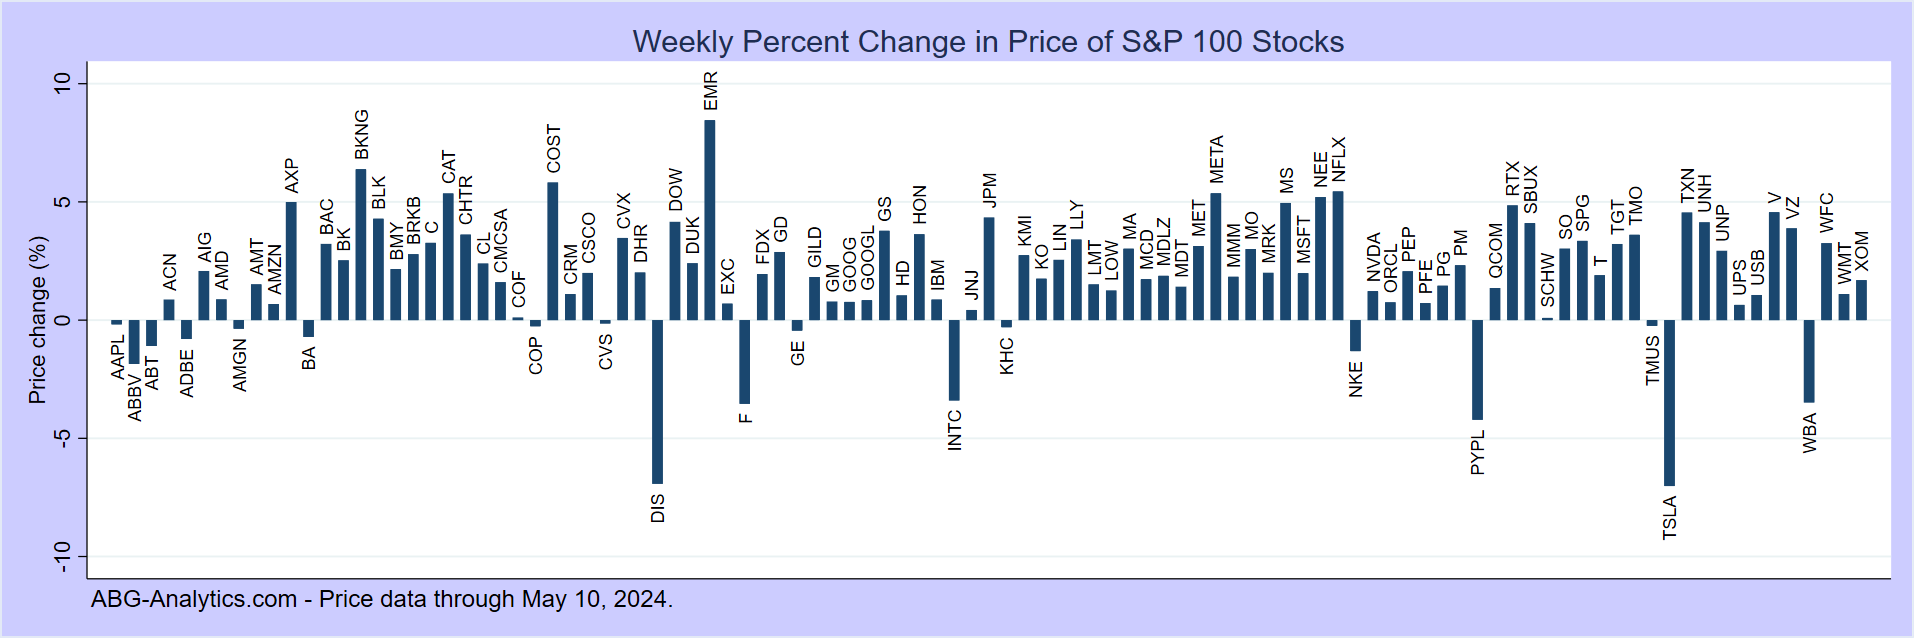
This Week's Best and Worst Performing Large-Cap Stocks
Top 10 Best-Performing Stocks
| Company Name | Ticker Symbol | 5-Day Percent Change | Chart link |
| Turn rapeutics Inc | TTRX | 32.6 | Price chart |
| Meta Platforms Inc | META | 14.8 | Price chart |
| NVIDIA Corporation | NVDA | 8.3 | Price chart |
| Advanced Micro Devices | AMD | 7.7 | Price chart |
| Cisco Systems Inc | CSCO | 7.6 | Price chart |
| Qualcomm Inc | QCOM | 7.3 | Price chart |
| Charles Schwab Corp | SCHW | 6.3 | Price chart |
| Texas Instruments Inc | TXN | 6.3 | Price chart |
| T-Mobile US Inc | TMUS | 5.7 | Price chart |
| Ford Motor Co | F | 4.8 | Price chart |
Top 10 Worst-Performing Stocks
| Company Name | Ticker Symbol | 5-Day Percent Change | Chart link |
| Intel Corp | INTC | -8.7 | Price chart |
| Lowes Companies Inc | LOW | -7.0 | Price chart |
| Netflix Inc | NFLX | -5.5 | Price chart |
| AbbVie Inc | ABBV | -5.0 | Price chart |
| GE Aerospace | GE | -4.8 | Price chart |
| Pepsico Inc | PEP | -4.7 | Price chart |
| Charter Communications | CHTR | -4.7 | Price chart |
| Merck & Co | MRK | -4.6 | Price chart |
| Lockheed Martin Corp | LMT | -4.2 | Price chart |
| Home Depot Inc | HD | -4.1 | Price chart |
We update this report at the end of each week. Sign up to receive Update
Notifications.