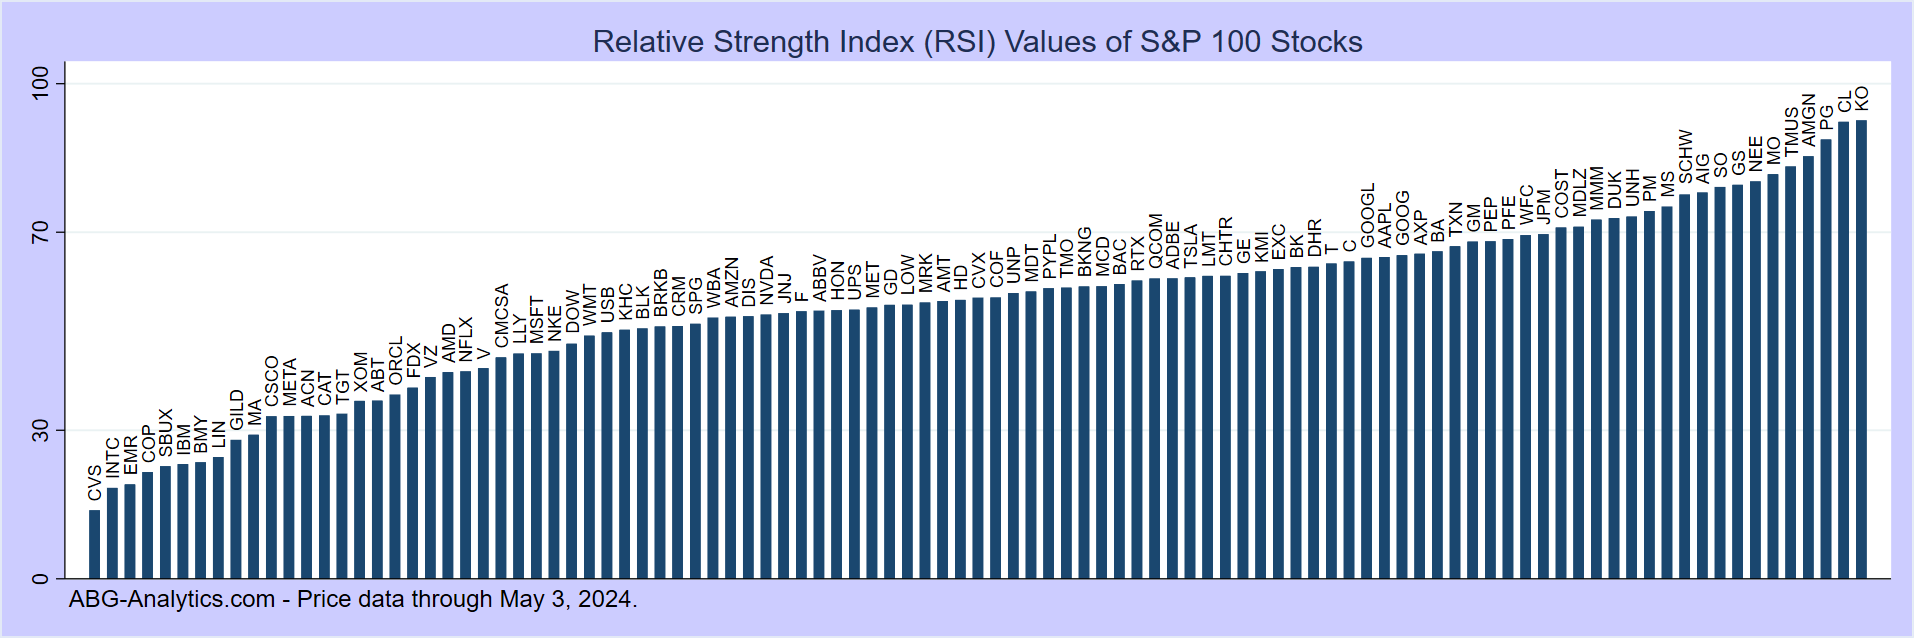
Oversold and Overbought Large-Cap Stocks
Stocks that move too far too fast in one direction have a slight tendency to experience short-term price reversals. The following tables list S&P-100 stocks that are oversold or overbought as measured by the 14-day Relative Strength Index (RSI). Stocks with RSI above 70 are considered overbought and more likely to experience a short-term price decline, while stocks with RSI below 30 are considered oversold and more likely to rebound in the short term. Here are this week's lists of low-RSI and high-RSI stocks:Oversold Stocks as of 07/10/2026
| Ticker - Company | Closing Price | 50-Day Moving Avg. | 200-Day Moving Avg. | RSI (14-Day) |
| DIS - Walt Disney Company | 95.62 | 101.47 | 105.88 | 29% |
| ORCL - Oracle Corp | 140.64 | 183.07 | 195.72 | 12% |
| QCOM - Qualcomm Inc | 189.16 | 206.82 | 168.88 | 29% |
Note: RSI = Wilder's Relative Strength Index. Oversold = (RSI < 30).
Overbought Stocks as of 07/10/2026
| Ticker - Company | Closing Price | 50-Day Moving Avg. | 200-Day Moving Avg. | RSI (14-Day) |
| ABBV - AbbVie Inc | 248.08 | 223.92 | 222.79 | 75% |
| ADBE - Adobe Systems Inc | 223.64 | 232.60 | 285.15 | 82% |
| AMGN - Amgen Inc | 363.39 | 343.61 | 337.51 | 75% |
| DHR - Danaher Corp | 199.05 | 180.16 | 204.04 | 72% |
| GD - General Dynamics Corp | 375.06 | 349.84 | 346.43 | 73% |
| IBM - International Business Machines Corp | 287.56 | 261.63 | 275.14 | 72% |
| JNJ - Johnson & Johnson | 256.98 | 236.11 | 221.07 | 72% |
| SCHW - Charles Schwab Corp | 103.12 | 91.57 | 94.90 | 79% |
| TMO - Thermo Fischer Scientific Inc | 527.05 | 477.55 | 527.51 | 77% |
| TTRX - Turn rapeutics Inc | 9.44 | 5.64 | . | 77% |
| UNP - Union Pacific Corp | 286.96 | 268.91 | 246.01 | 89% |
Notes:
Note: RSI = Wilder's Relative Strength Index. Overbought = (RSI > 70).