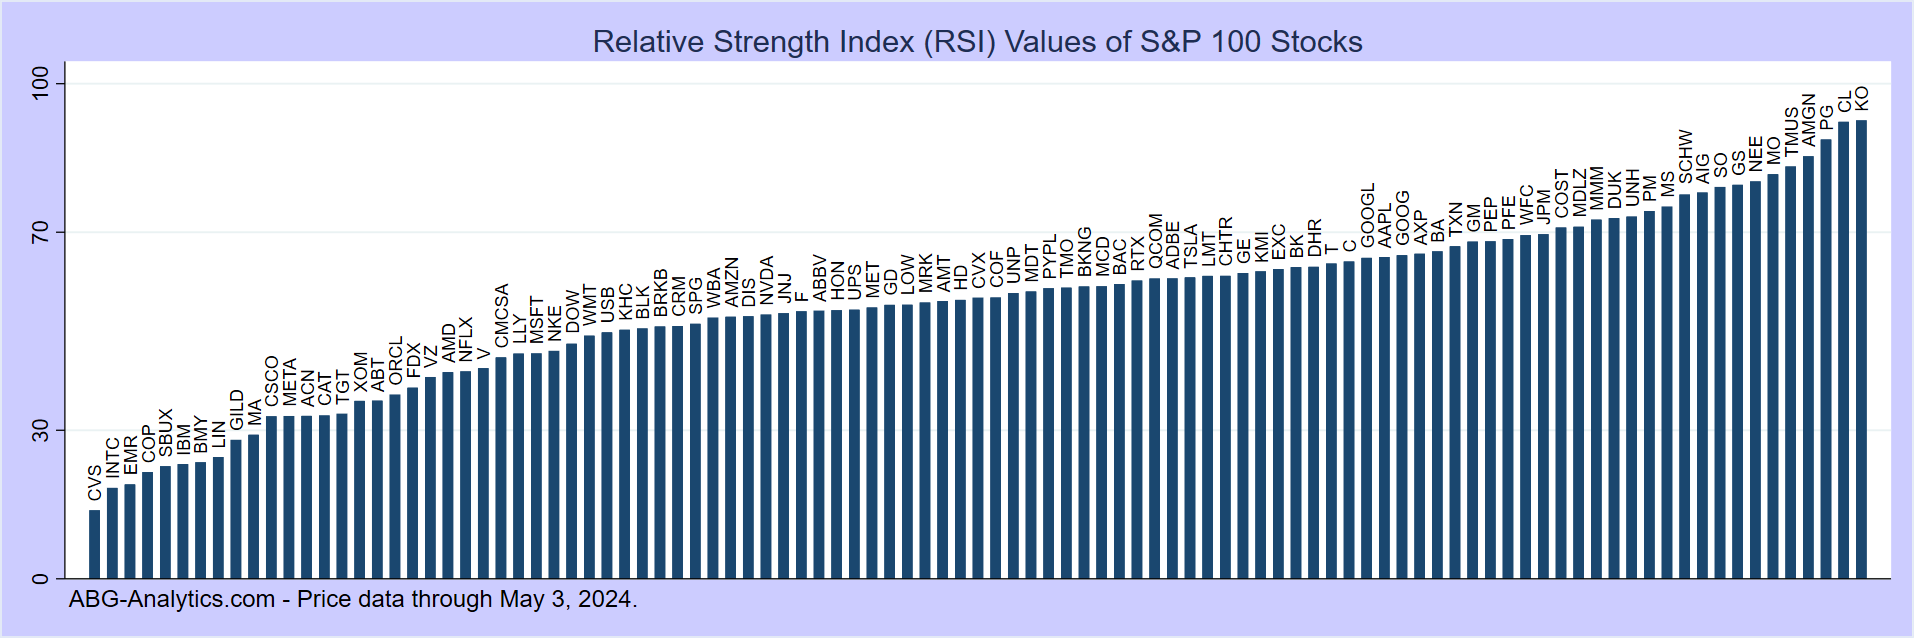
Oversold and Overbought Large-Cap Stocks
Stocks that move too far too fast in one direction have a slight tendency to experience short-term price reversals. The following tables list S&P-100 stocks that are oversold or overbought as measured by the 14-day Relative Strength Index (RSI). Stocks with RSI above 70 are considered overbought and more likely to experience a short-term price decline, while stocks with RSI below 30 are considered oversold and more likely to rebound in the short term. Here are this week's lists of low-RSI and high-RSI stocks:Oversold Stocks as of 04/19/2024
| Ticker - Company | Closing Price | 50-Day Moving Avg. | 200-Day Moving Avg. | RSI (14-Day) |
| ABBV - AbbVie Inc | 166.41 | 175.24 | 156.04 | 25% |
| ACN - Accenture Ltd | 316.88 | 355.69 | 333.25 | 23% |
| ADBE - Adobe Systems Inc | 465.02 | 530.93 | 553.16 | 22% |
| AMD - Advanced Micro Devices | 146.64 | 179.39 | 135.99 | 23% |
| AMT - American Tower Corp | 171.30 | 191.96 | 189.57 | 17% |
| BA - Boeing Co | 169.82 | 190.71 | 210.11 | 11% |
| BLK - Blackrock Incorporated | 749.98 | 804.33 | 736.79 | 18% |
| BMY - Bristol-Myers Squibb Co | 48.93 | 51.12 | 54.49 | 24% |
| CRM - Salesforce Inc | 270.37 | 297.12 | 247.09 | 25% |
| CVS - CVS Health Corporation | 69.75 | 75.18 | 72.74 | 19% |
| DHR - Danaher Corp | 235.51 | 248.71 | 227.82 | 29% |
| DIS - Walt Disney Company | 112.61 | 113.68 | 94.37 | 25% |
| EMR - Emerson Electric Co | 108.58 | 109.70 | 97.71 | 22% |
| F - Ford Motor Co | 12.14 | 12.58 | 12.10 | 29% |
| GILD - Gilead Sciences Inc | 66.76 | 72.01 | 76.60 | 18% |
| GM - General Motors Company | 42.37 | 41.51 | 35.64 | 23% |
| HD - Home Depot Inc | 335.36 | 367.00 | 333.40 | 15% |
| INTC - Intel Corp | 34.20 | 41.81 | 39.89 | 11% |
| JNJ - Johnson & Johnson | 147.91 | 156.11 | 158.47 | 23% |
| JPM - JPMorgan Chase and Co | 185.80 | 188.24 | 162.88 | 28% |
| LOW - Lowes Companies Inc | 230.24 | 238.84 | 220.33 | 23% |
| MA - Mastercard Incorporated | 455.39 | 471.04 | 423.60 | 25% |
| MDT - Medtronic PLC | 79.48 | 83.93 | 81.71 | 18% |
| MRK - Merck & Co | 125.78 | 126.02 | 112.63 | 21% |
| MSFT - Microsoft Corp | 399.12 | 415.05 | 367.68 | 27% |
| NVDA - NVIDIA Corporation | 762.00 | 840.47 | 568.90 | 29% |
| ORCL - Oracle Corp | 114.88 | 119.16 | 113.73 | 24% |
| PFE - Pfizer Inc | 26.00 | 27.11 | 30.74 | 25% |
| SPG - Simon Property Group | 140.44 | 149.05 | 129.49 | 20% |
| T - AT&T Inc | 16.51 | 16.98 | 15.90 | 26% |
| TGT - Target Corporation | 168.30 | 163.03 | 136.27 | 30% |
| TSLA - Tesla Inc | 147.05 | 178.66 | 224.98 | 29% |
| TXN - Texas Instruments Inc | 159.68 | 167.86 | 164.24 | 29% |
| UNP - Union Pacific Corp | 232.08 | 245.40 | 228.64 | 23% |
| USB - US Bancorp | 40.45 | 42.20 | 38.68 | 27% |
Note: RSI = Wilder's Relative Strength Index. Oversold = (RSI < 30).
Overbought Stocks as of 04/19/2024
| Ticker - Company | Closing Price | 50-Day Moving Avg. | 200-Day Moving Avg. | RSI (14-Day) |
Notes:
Note: RSI = Wilder's Relative Strength Index. Overbought = (RSI > 70).